Epi week to ISO week - overlaying virus case data with mobility.
WARNING: This article is inaccurate due to my misunderstanding of the way Paho was posting data. Will correct shortly.
Here, at the Office of Innovation at UNICEF, we’re preparing a country level map of Zika risk. This will help country offices better understand and prepare for potential outbreaks on a week to week basis.
Formulas to compute scores for each country have been given to us by our data scientists, but first, we, the software developers, need to fetch and prepare key data inputs. We’ll begin with four:
- A raster file representing The global distribution of the arbovirus vectors Aedes aegypti and Ae. albopictus.
- Weekly international flight mobility provided by Amadeus.
- Reports of zika virus cases in the Americas, published by the Pan American Health Organization.
- Population data from worldpop.org.uk
In this article, we won’t focus on how we calculate risk, but rather, on how we prepare the data, specifically, the challenge of overlaying case data from Paho, with travel data from Amadeus.

Each Paho file contains a running cumulative count of zika cases per country, and spans a single Epi week. The number of days in between Paho files is usually 7 (ending on a Thursday), though sometimes 6. (ISO weeks begin on a Monday.) Subtracting this week’s cumulative cases from last week’s cumulative cases leaves you with that country’s total number of new cases.
To group new Epi week cases by ISO week, we begin with a simple “week to day” algorithm — i.e., take the total number of new cases, divide it by the number of days since the publication of the last Paho file, and assign that value to each day leading up to the end of that epi week.
For example, look at the file for the Epi week lasting Jan 6, 2017 through the twelfth. It lists 36,375 total cases in Puerto Rico. The previous file for the week ending on the 5th lists 36,326 confirmed cases. This means there were around 49 new cases.
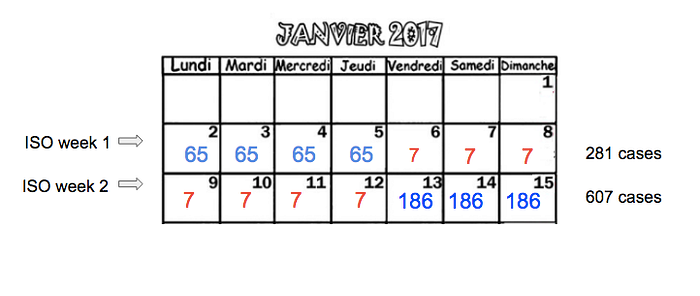
Based on the “week to day” model, we divide 49 by 7 and assign 7 cases per date:

Now group by ISO week:
Friday the 6th, Saturday the 7th, and Sunday the 8th of January, 2017 all fall within the iso week starting Monday, January 2. The remaining days: the 9th, 10th, 11th, and 12th, fall within the iso week of Monday, January 9.

Thus, values for the first Epi week of 2017 get spread over its first two ISO weeks.
In order to get the total number of new cases for the first two ISO weeks, we would have to consider:
- The Epi week of Dec 30, 2016 to Jan 5: 456 new cases
- And Jan 12 through 18: 1,113 new cases
So the calendar looks like this:
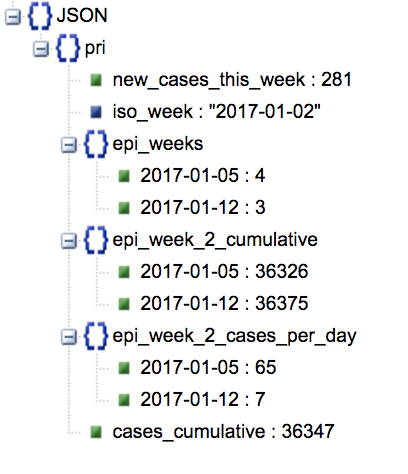
Here’s how the first ISO week of January looks for Puerto Rico as a common data format like JSON:
Here is a repository for downloading, summarizing and transforming paho.org Zika case data to ISO weeks.
If you’d like to fetch all zika case data to date for either week type from the API, use these end points:
- magicbox-open-api.azurewebsites.net/api/v1/cases/kinds/zika/weekTypes/iso
- magicbox-open-api.azurewebsites.net/api/v1/cases/kinds/zika/weekTypes/epi
Pratik Kulkarni, who joined us from RIT this past summer, helped code both applications.
If you know of any other sources of case data for the Americas or elsewhere in the world, please leave a comment or message me.
The next article will be about how we calculate and vizualize Zika risk, based on the formulas and narratives by Manuel Garcia-Herranz and Suad Al Darra.
